Jinda Fan

Research
Radiochemistry and Radiotracer Development for PET Imaging
(Research Description PDF)
Positron emission tomography (PET) is a powerful imaging tool for visualization and quantification of cellular and molecular processes in live animals and in humans as well. PET is a technique relies on radiotracers bearing positron emitters that decay inside the body of studied subjects. Thus radiotracers are essential for the success of PET imaging. My research interests focus on development of carbon-11 and fluorine-18 labeled radiotracers for imaging of cancer diseases, brain disorders and cardiovascular illnesses using PET. These developed radiotracers are employed in both preclinical and clinical research for disease diagnosis, treatment assessment, surgery evaluation and drug development. Tracer development is an interdisciplinary process including to select a target, to design the radiotracers of the target, to synthesize the radiotracers, to evaluate the tracers in vitro and in vivo, with the information to optimize the structures and labeling positions of the radiotracer, to select promising candidates to be synthesized by an automated synthesis module, and to translate the radiotracers to clinical trials. Chemistry is indispensable in the process, expertise of such chemical fields are involved: organic synthesis, medicinal chemistry, radiopharmaceutical chemistry etc. Analytical chemistry also plays a critical role for the purification and quality control of radiotracers. Equipment includes but not limit to HPLC, Mass Spectrometry, Gas Chromatography, and Gamma Spectrometry. Moreover, the developmental process also involves in vitro evaluation of radiotracers with proteins and cells, in vivo validation with animals such as rodents and nonhuman primates, and translation to clinical studies. In addition to PET imaging, I am also interested in radioimmunotherapy, such as targeted alpha-therapy of different types of cancer, using alpha emitter lead-212 labeled monoclonal antibodies.
Development of PDE10A radiotracers for imaging the enzyme in tumors and to support the development of anticancer drugs targeting PDE10A in colon, lung and breast tumors. PDE10A has been mostly studied as a therapeutic target for certain psychiatric and neurological conditions. Recently, it has been reported that PDE10A is overexpressed in certain colon, lung and breast tumors, and the inhibition of PDE10A in tumor show promising anticancer effects; however, the role of PDE10A in tumor is barely studied. The overall goal is to radiolabel a highly potent and selective PDE10A PET radiotracer for PET imaging of tumor overexpressed PDE10A in animal models.
![PET imaging results of Rhesus monkeys using [11C]MP-10, a representative summed image from 0 to 120 min is overlay with MRI images to accurately identify the regions of interest, caudate and putamen.](/sites/_chemistry/assets/Image/research/Jinda%20Figure%20B.png)
![Representative summed image of [18F]FEMP-10, axial, coronal, and sagittal images of a monkey's brain.](/sites/_chemistry/assets/Image/research/Jinda%20Figure%20C.png)
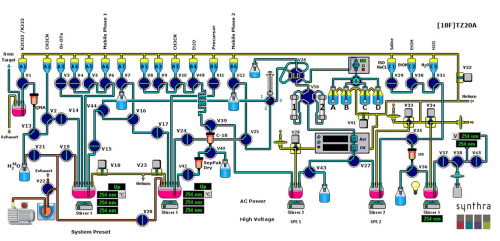
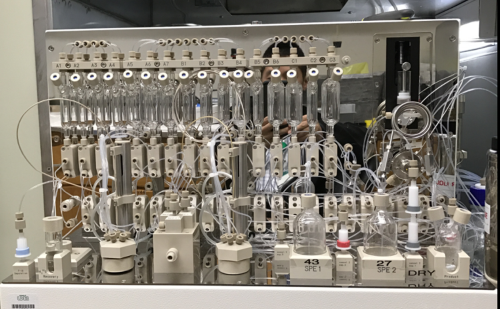
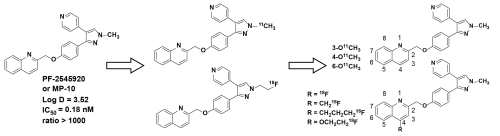
Figure A: A scheme demonstrates the development of 18F and 11C PET radiotracers for PDE10A,
from MP-10, a
potent and highly selective PDE10A inhibitor, the first generation of tracers were
labeled on the pyrazole
moiety, and to improve metabolic stability, the second generation tracers were labeled
on the quinoline.
Figure B: PET imaging results of Rhesus monkeys using [11C]MP-10, a representative summed image from 0 to
120 min is overlay with MRI images to accurately identify the regions of interest,
caudate and putamen.
Figure C: Representative summed image of [18F]FEMP-10, axial, coronal, and sagittal images of a monkey's
brain.
Figure D: A program chart displays the work flow on an automated synthesis module.
Figure E: A picture of the synthesis module, on which the radiolabeling synthesis is conducted.